
How to Diagnose a Growth Plateau Before the Board Asks You To

Growth plateaus don't announce themselves. By the time they're visible in the board deck, they're already six months old.
The Problem With Reactive Diagnosis
Here's the typical sequence.
Pipeline is flat for a quarter. Leadership starts asking questions. The CMO pulls reports, schedules a retrospective, and begins the uncomfortable process of explaining why growth has stalled. By the time the diagnosis is complete, two things have happened: another quarter has passed and credibility has been spent.
The diagnosis wasn't wrong. It was late.
Most mid-market growth teams operate on a reactive diagnostic cycle — they identify problems when they show up in revenue, which means they're always working on signals that are 60 to 90 days old. The plateau was forming while the dashboards looked fine. By the time the numbers confirmed it, the window for low-cost intervention had already closed.
This post is about building the habit of reading earlier signals — the ones that appear in your data before the plateau shows up in pipeline. Not because you can prevent every downturn, but because catching a problem at 90 days is significantly cheaper, less political, and more fixable than catching it at zero.
Why Plateaus Are Always Older Than They Look
Before getting into the signals, it's worth understanding why growth plateaus are structurally lagged — why by the time they're visible, they've already been building for months.
The core reason is pipeline delay. Most B2B sales cycles run 30 to 90 days from first touch to closed-won. That means a decline in MQL quality or volume in month one doesn't show up in closed revenue until month three or four. By the time the board is looking at flat revenue, the root cause event happened months ago.
Layered on top of that is reporting delay. If your attribution model is fragmented — multiple dashboards, no single source of truth — degrading signals don't surface cleanly. CAC rises slowly. Conversion rates drift down by fractions. Each individual number looks within range. The pattern only becomes visible when you look at the trend across three or four months and compare channels consistently.
The result is that most plateaus are diagnosed at zero — the moment they become undeniable — rather than at 60 or 90 days, when they were still diagnosable and correctable without a board-level conversation.
The Six Warning Signals
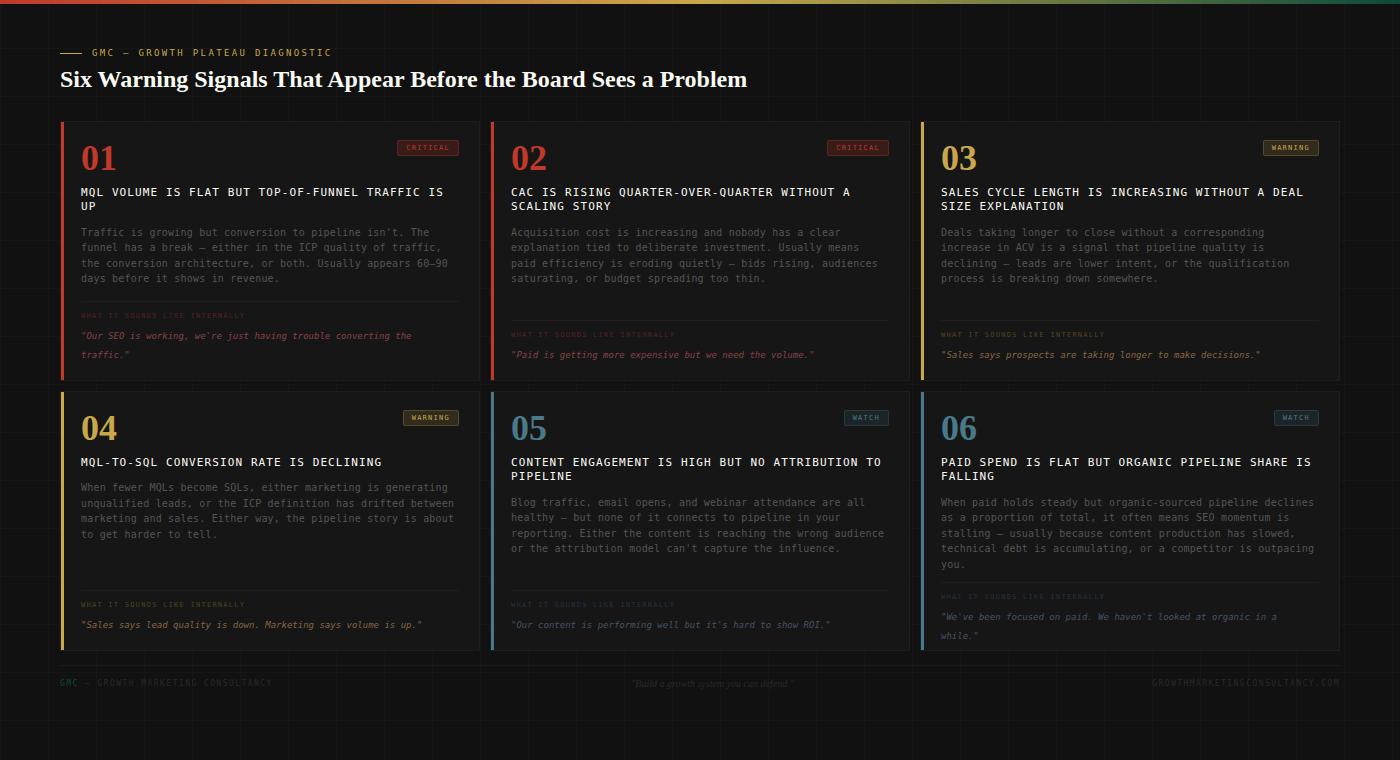
These are the signals worth monitoring systematically — not because each one is individually alarming, but because the combination of two or more is almost always an early indication of a plateau forming.
Signal 1: MQL volume is flat but top-of-funnel traffic is growing. This is one of the most reliable early warnings and one of the most commonly misread. Traffic growth feels like progress. But if the conversion from traffic to pipeline isn't keeping pace, the funnel has a break — either in the ICP alignment of the traffic you're generating, the conversion architecture of your landing pages, or both. This typically appears in the data 60 to 90 days before it shows up in pipeline. The internal narrative is usually "our SEO is working, we're just having trouble converting the traffic" — which is the diagnostic, not the excuse.
Signal 2: CAC is rising quarter-over-quarter without a deliberate scaling story. CAC should rise when you're intentionally investing in a new channel or expanding reach into a harder-to-reach audience. When it rises without that deliberate context, it usually means paid efficiency is eroding — bid costs rising, audiences saturating, creative fatiguing. Most teams don't notice until the CFO asks why the cost per lead has increased by 30% over six months. The signal was there at month two.
Signal 3: MQL-to-SQL conversion rate is declining. When fewer MQLs become SQLs, the instinct is to say the leads are lower quality. That's sometimes true. But the more common root cause is ICP drift — marketing and sales are operating on a definition of the ideal customer that hasn't been reviewed since it was written, while the market or the product has shifted. Either way, this signal means pipeline quality is about to get harder to defend. When you hear "sales says lead quality is down, marketing says volume is up" — that's the signal.
Signal 4: Sales cycle length is increasing without a corresponding increase in ACV. Deals taking longer to close is acceptable when deal sizes are growing — you'd expect complex enterprise deals to take more time. When cycle length increases without ACV growth, it usually means intent quality is declining. Prospects are engaging but aren't ready to buy. The pipeline looks healthy on volume but the velocity is draining out of it.
Signal 5: Content engagement is high but nothing ties to pipeline. High content engagement with no attribution to pipeline is often misread as an attribution problem rather than a targeting problem. Sometimes it is an attribution problem — your model only credits last touch and content influence is invisible. But often it's a signal that your content is reaching an audience that finds it interesting but isn't your buyer. Distinguishing between the two requires looking at who is engaging, not just how much.
Signal 6: Paid spend is flat but organic pipeline share is declining. When paid holds steady but organic-sourced pipeline declines as a proportion of total, it usually means SEO momentum is stalling. This is almost always a lagged signal — the content slowdown or technical debt accumulation happened months ago, and the ranking and traffic effects are only now showing up. By the time organic pipeline share is visibly declining, you're already six months behind on the fix.
Reading Symptoms vs Root Cause
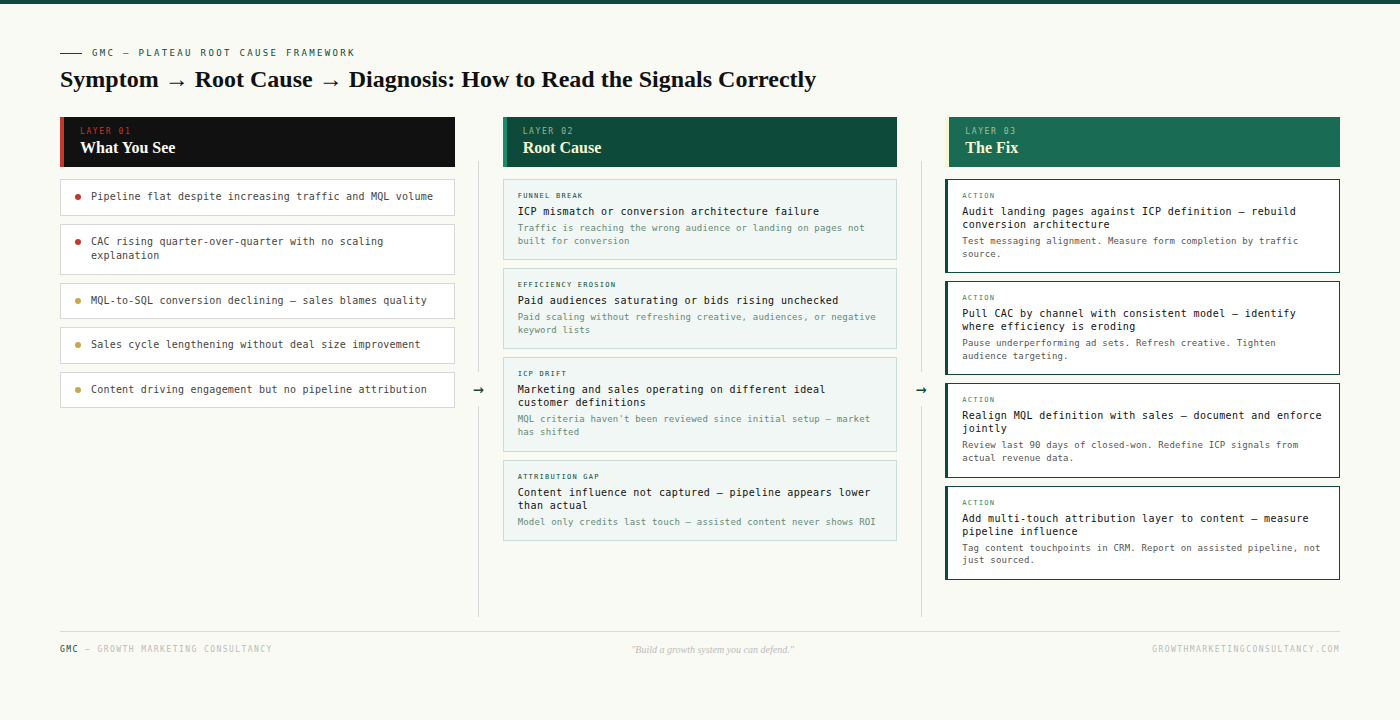
The most common mistake in plateau diagnosis is treating the symptom as the problem. Flat MQLs lead to a campaign push. Rising CAC leads to a bid optimisation. Declining SQL conversion leads to a sales enablement initiative.
These interventions aren't wrong — they just don't address the underlying cause, which means the symptom returns.
The discipline of plateau diagnosis is following each signal one layer deeper before deciding what to do. Flat MQLs despite traffic growth is a symptom. The root cause is either an ICP mismatch in the traffic being generated or a conversion architecture failure on the pages receiving it. Those have different fixes. A campaign push addresses neither.
A useful diagnostic habit is asking, for each signal you observe: if we fix the symptom directly, does the root cause change? If the answer is no, you're not at the diagnosis yet.
The 30-Day Early Warning Audit
If you want to build the habit of catching plateaus early, here is the minimum viable monitoring routine — the metrics worth reviewing monthly with enough rigour to catch trends before they compound.
Week 1: Funnel conversion audit. Pull traffic-to-MQL conversion rate by source. Compare to the same period three months ago. If organic traffic is up but conversion is flat or down, that's signal one. If paid traffic is converting at a lower rate than it was six months ago, that's signal two.
Week 2: CAC trend review. Calculate CAC by channel using a consistent model — total spend divided by attributed pipeline, not what each platform reports. Plot it over six months. A rising trend without a deliberate scaling explanation is worth investigating before it becomes a board question.
Week 3: Pipeline quality check. Pull MQL-to-SQL conversion rate for the last 90 days and compare to the 90 days before that. If it's declining, schedule a 30-minute session with sales to review the last 20 closed-lost deals. The pattern in closed-lost is usually the clearest early signal of ICP drift.
Week 4: Organic pipeline share. Calculate what percentage of sourced pipeline came from organic channels this month versus three months ago. If the share is declining, look at the SEO metrics six months back — that's usually where the cause is.
None of these reviews take more than two hours individually. Run them monthly, compare trends over rolling 90-day windows, and you'll see most plateaus forming 60 to 90 days before they show up in a board deck.
What to Do When You Spot a Signal
The instinct when you identify an early warning signal is to fix it immediately. Resist that instinct until you're confident you're at the root cause rather than the symptom.
For each signal you identify, spend one week on diagnosis before prescription. Pull the underlying data. Talk to the people closest to it — the sales rep who's seeing cycle lengths increase, the analyst who built the attribution model, the paid media manager who's watching bid costs. Get to the root cause before you decide what to change.
Then make one change at a time, with a clear measurement plan. The most common plateau recovery failure is changing too many things simultaneously — which makes it impossible to know what worked and turns the next board conversation into another set of contested claims.
The goal of early diagnosis is not to avoid bad news. It's to arrive at the board meeting with a narrative that starts two sentences earlier: "We identified this signal in January, which is why we made this change in February, and here's what it's produced."
That's not spin. That's a growth system operating the way it should.
Growth Marketing Consultancy builds unified GTM systems for PE-backed and founder-led mid-market companies. If pipeline is softening and you'd rather diagnose it now than explain it later, book a Growth System Audit.